
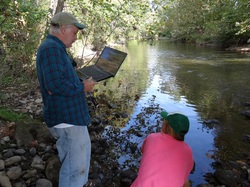
Probing
At each river, we took three samples of nitrate, DO, BOD, ammonia, turbidity, and pH. We split the river into sections of near, middle and far. At rivers that were not very wide we would probe the length by above, middle, and below. We also took one sample of the remaining indicators (conductivity, temperature, E-coli, and phosphate). These are all convenient samples.
Measuring Phosphate
No probes are available for the measurement of phosphate ions. As a result we used a colorimeter (Vernier) to measure total phosphate (orthophosphates, organically bound phosphates, polyphosphates).
Procedure:
1. Collect 25 ml of sample water
2. Add one 10 ml sample of Phosphate Reagent (Phos Ver 3 Phosphate Reagents (Hach :Cat # 21060-69)) to the 25 ml sample.
3. Swirl solution until the powder is dissolved. (about 5 minutes)
4. Fill plastic cuvette included in the Vernier Colorimeter test kit with treated water.
5. Calibrate colorimeter to 565 nm wavelength.
6. Follow directions for Vernier colorimeter reading .
7. Record absorbance value. This is the value recorded and analyzed in the data. The conversion to mg/l was not made. However, based on published data, Beer’s Law indicates a linear relationship between absorbance values for phosphates and mg/l, with little discrepancy between the readings. For example, an absorbance reading of 0.1 is approximately 0.1 mg/l.
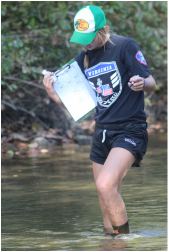
Benthic
For two minutes we held a net in the river and kicked up and rubbed the rocks at the bottom of the river to collect a benthic data sample. After collecting the benthic we would identify each specimen and record the data until we reached 200 specimens. If we did not reach 200 specimens, we would repeat this process up to three times.
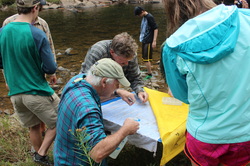
Data Collection
For benthic we used tallies as outlined by Stream Watch to record each specimen. The data for the probes was recorded on a sheet that had each indicator of health.

Analysis
We split into two groups, based on two different methods, to reach a conclusion that answered our essential question. After six months of data collection, research, and statistical analysis (using Fathom software), both groups concluded that the Rivanna River watershed was unhealthy.
